AI'sRiseandSocietalImpact
Interactive Data Visualization
Project Introduction
This interactive Tableau dashboard explores the multifaceted impact of artificial intelligence on industries, employment patterns, and broader society. By visualizing comprehensive data on AI adoption trends, automation risks, and the evolving job market, this project presents a data-driven narrative of one of the most transformative technological shifts of our time.
As a data analyst with a keen interest in emerging technologies, I created this visualization to help organizations, professionals, and policymakers understand the complex implications of AI proliferation. The dashboard transforms raw data into actionable insights, enabling users to make informed decisions about workforce planning, skill development, and strategic investments in an AI-driven economy.
Interactive Dashboard
Business Value
This dashboard delivers significant business value by providing decision-makers with critical intelligence on AI's impact across various domains:
- Strategic Planning: Organizations can identify which sectors are experiencing the most rapid AI adoption, allowing for more informed competitive positioning and investment decisions.
- Workforce Development: HR departments can anticipate automation risks across different roles, enabling proactive reskilling initiatives and talent acquisition strategies.
- Market Intelligence: Investors and business leaders can track global investment patterns in AI technologies, identifying emerging opportunities and potential market disruptions.
- Risk Management: The visualization of regulatory trends helps organizations anticipate compliance requirements and adjust their AI implementation strategies accordingly.
- Public Perception Tracking: Marketing teams can better understand shifting consumer sentiment toward AI, informing product development and communication strategies.
By consolidating these insights into an interactive interface, the dashboard empowers stakeholders to extract actionable intelligence that could drive millions in strategic value through optimized workforce planning, targeted investments, and risk mitigation.
Tools & Methodology
Technical Approach
- Tableau Desktop: Leveraged for its robust visualization capabilities and interactive filtering options
- Interactive Elements: Created dynamic parameters, filters, and drill-down capabilities to enable exploratory analysis
- Design Principles: Applied strategic color theory, information hierarchy, and accessibility considerations throughout
Data Sources
This project draws on authoritative data from multiple sources, including:
- Data on AI job market trends from Kaggle datasets (Edwardan, 2024)
- AI adoption metrics from Stanford's AI Index Report 2024
- Tech industry workforce shifts documented by Ulrike Herold (2024)
- Labor market projections from the World Economic Forum's Future of Jobs Report 2023
- Economic impact analysis from leading research by Acemoglu & Restrepo (2019)
- Workforce transition data from McKinsey Global Institute (2017)
- Employment outlook projections from OECD (2019)
The data underwent rigorous cleaning, normalization, and validation before visualization to ensure accuracy and relevance.
Development Process
Planning Phase
The project began with extensive research to identify the most relevant aspects of AI's impact that would provide value to users. I created initial wireframes to map out the information architecture and user flow through the dashboard.
Data Collection Challenges
Collecting consistent data across regions proved challenging, particularly for AI adoption metrics. I addressed this by normalizing datasets and creating composite indices where appropriate, ensuring meaningful cross-regional comparisons.
Iterative Design
The dashboard underwent multiple iterations based on user feedback. Early versions prioritized comprehensive data display, while later iterations focused on storytelling and user experience. I continuously refined filters and interactive elements to balance analytical depth with usability.
Features & Functionality
Interactive Capabilities
- Global Filter Panel: Allows filtering by region, industry, time period, and technology type
- Drill-Down Architecture: Users can navigate from high-level trends to granular details about specific roles, regions, or technologies
- Custom Parameters: Dynamic adjustments for time horizons, risk thresholds, and investment categories
- Comparative Analysis: Side-by-side visualization of different regions, industries, or time periods
- Responsive Design: Optimized for both desktop analysis and tablet presentation scenarios
Visual Components
- Heat maps displaying automation risk across job categories
- Time-series visualizations of AI investment trends
- Geographic distribution of AI job opportunities
- Regulatory response timeline with policy impact assessment
- Public sentiment tracking with demographic breakdown
Each component was designed to work both independently and as part of an integrated analytical narrative.
Key Insights
Global AI Investment Landscape
The United States maintains a commanding lead with $67.2 billion in private AI investments in 2023, representing nearly triple the investment of its closest competitor. This concentration of capital has significant implications for global AI innovation distribution and potential technology transfer barriers.
Automation Risk Distribution
Contrary to common assumptions, high-salary positions aren't immune to automation risk. The dashboard reveals that roles like Marketing Specialists (average salary: $106K) face significant disruption potential due to advancements in natural language processing and predictive analytics. This challenges conventional wisdom about which career paths offer long-term stability.
Industry Adoption Patterns
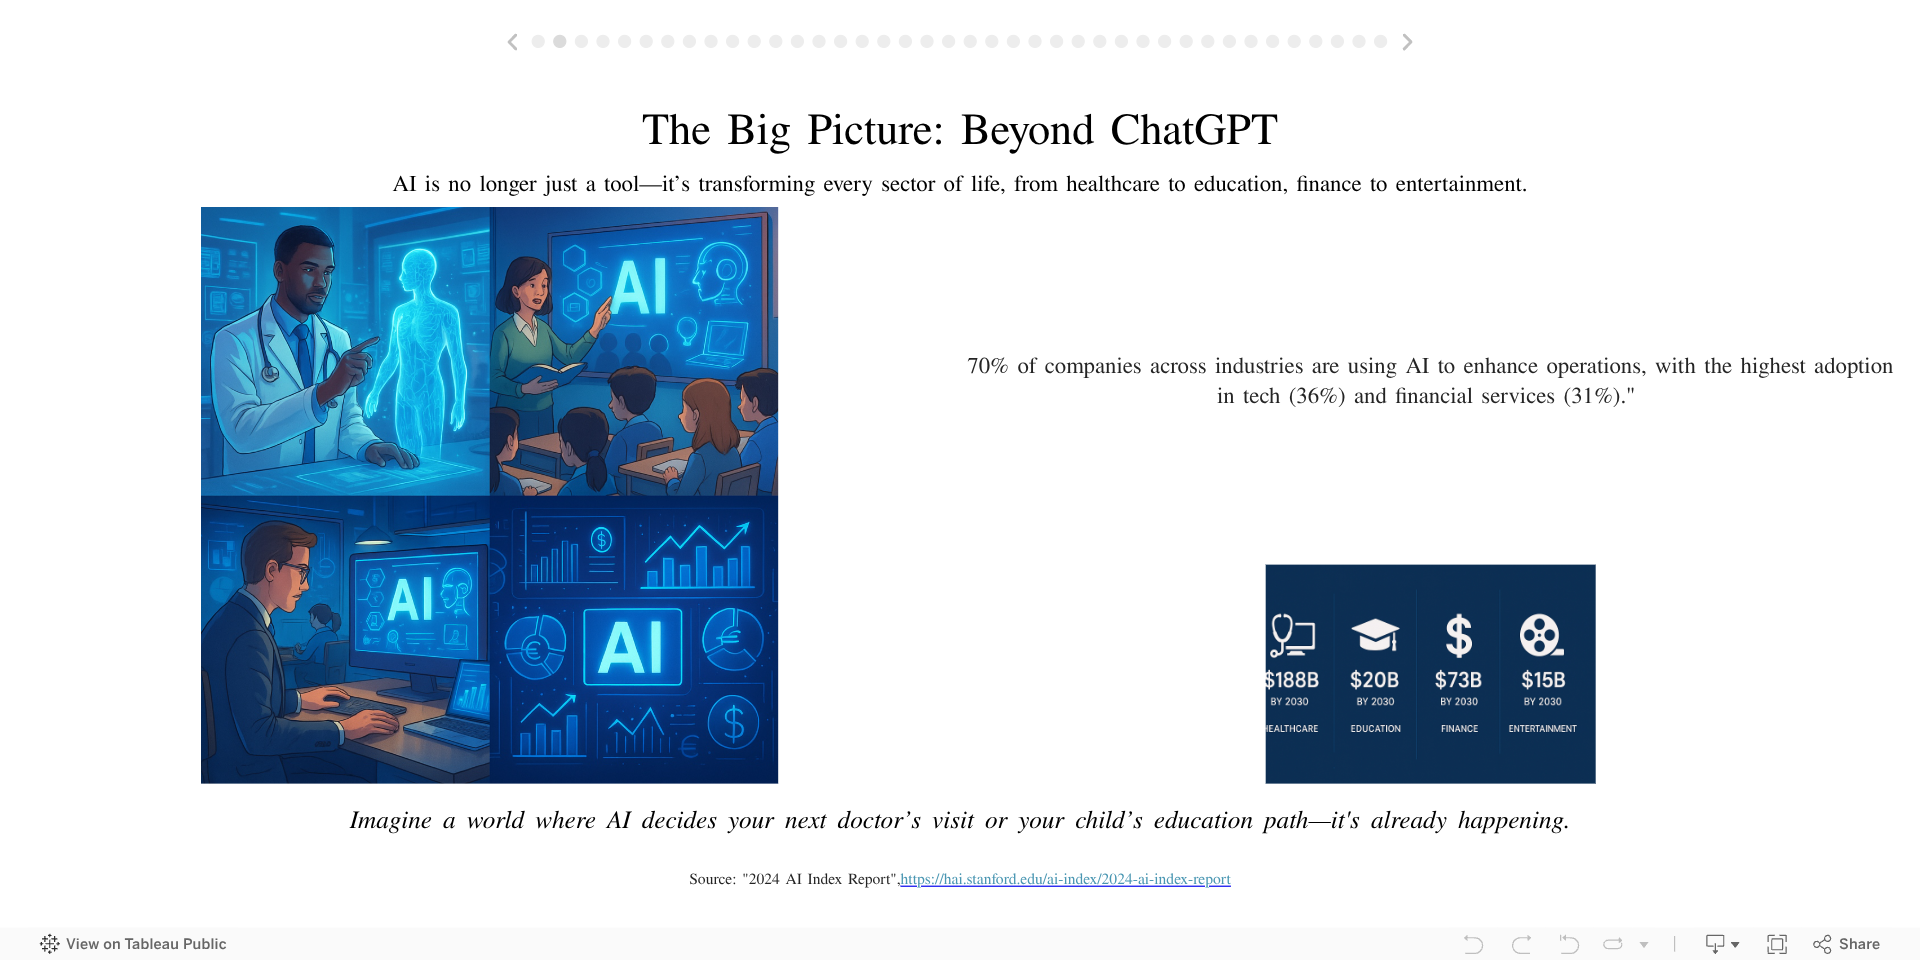
While the technology sector leads with 36% AI adoption, the financial services industry follows closely at 31%, demonstrating faster-than-expected integration. Healthcare shows the steepest adoption curve, suggesting potential market opportunities for specialized AI solutions in clinical and operational contexts.
Job Market Transformation
The dashboard visualizes how AI job postings have evolved beyond traditional computer science roles. By 2022, machine learning skills appeared in 5.7% of all job postings across diverse fields including marketing, finance, and healthcare, indicating the mainstreaming of AI competencies.
Geographic Distribution of Opportunity
The United States dominates the global AI job market with 55.1% of all job postings, followed by India at 14.96%. However, the visualization reveals emerging hubs in unexpected regions, with Southeast Asia showing the fastest growth rate in new AI positions (37% year-over-year).
Skills Demonstrated
Advanced Tableau Techniques
Custom calculations, parameters, sets, and level-of-detail expressions
Data Transformation
Handling complex, multi-source datasets with varying granularity and structure
Visual Design
Strategic use of color, shape, and space to maximize information density without compromising clarity
Narrative Construction
Creating a cohesive analytical story that guides users through complex information
User Experience Design
Balancing sophisticated analytical capabilities with intuitive navigation and interaction
Conclusion and Next Steps
This interactive dashboard provides a comprehensive view of AI's impact across industries and geographies, serving as both an analytical tool and a strategic resource. The insights generated can help organizations navigate the rapidly evolving AI landscape with data-driven confidence.
I invite you to explore this dashboard to uncover insights relevant to your organization or career path. The interactive elements allow you to filter and focus on the aspects most relevant to your context.
I welcome discussions about the methodology, findings, or potential applications of this analysis. If you're interested in exploring how similar visualizations could provide value for your specific needs, please reach out through the contact information provided on my portfolio.
This project demonstrates not only technical proficiency in data visualization but also my ability to transform complex datasets into strategic insights that drive business value.
References
Edwardan, K. (2024). AI-Powered Job Market Insights [Dataset]. Kaggle. https://www.kaggle.com/datasets/edwardan/ai-powered-job-market-insights
Stanford Institute for Human-Centered Artificial Intelligence. (2024). AI Index Report 2024. https://hai.stanford.edu/ai-index/2024-ai-index-report
Ulrike Herold. (2024). Tech Layoffs 2020–2024 [Dataset]. Kaggle. https://www.kaggle.com/datasets/ulrikeherold/tech-layoffs-2020-2024
World Economic Forum. (2023). The Future of Jobs Report 2023. https://www.weforum.org/reports/the-future-of-jobs-report-2023
Acemoglu, D., & Restrepo, P. (2019). Artificial Intelligence, Automation, and Work. NBER Working Paper No. 24196. https://www.nber.org/papers/w24196
McKinsey Global Institute. (2017). Jobs Lost, Jobs Gained: Workforce Transitions in a Time of Automation. https://www.mckinsey.com/featured-insights/future-of-work/jobs-lost-jobs-gained-what-the-future-of-work-will-mean-for-jobs-skills-and-wages
OECD. (2019). The Future of Work: OECD Employment Outlook 2019. https://www.oecd.org/employment/Employment-Outlook-2019-Highlight-EN.pdf